Root Cause Analysis
Root cause analysis (RCA) is a method of problem solving used to identify faults, problems and/or complications. When the “root cause” is identified and changes are implemented, centers can interrupt the fault-sequence, thus preventing the undesirable outcomes from reoccurring. It is not a single or sharply-defined process using various tools and processes.
Root cause analysis v. causal factor
A causal factor is one that affects an event’s outcome; however, the problem-fault-sequence is not eradiated as it is not a root cause. Thus, the causal factor helps to minimize problems but does not remove them.
Root cause diagrams models
Frequently, the Ishikawa diagrams (also called fishbone diagrams, herringbone diagrams, cause-and-effect diagrams, or Ishikawa) are used in RCA. The Ishikawa diagram was created by Kaoru Ishikawa (1968) to show the causes of a specific event. Common uses of the Ishikawa diagram are product design and quality defect prevention to identify potential factors causing an overall effect. Each cause or reason for imperfection is a source of variation. Causes are usually grouped into major categories to identify these sources of variation to include:
- People – anyone involved with the process;
- Methods – how the process is performed and the specific requirements for doing it, such as policies, procedures, rules, regulations and laws;
- Machines – any equipment, computers, tools, etc. required to accomplish the job;
- Materials – raw materials, parts, pens, paper, etc. used to produce the final product
- Measurements – data generated from the process that are used to evaluate its quality; and
- Environment – the conditions, such as location, time, temperature, and culture.
The basic concept was first used in the 1920s and is considered one of the seven basic tools of quality control. It is known as a fishbone diagram because of its shape, similar to the side view of a fish skeleton.
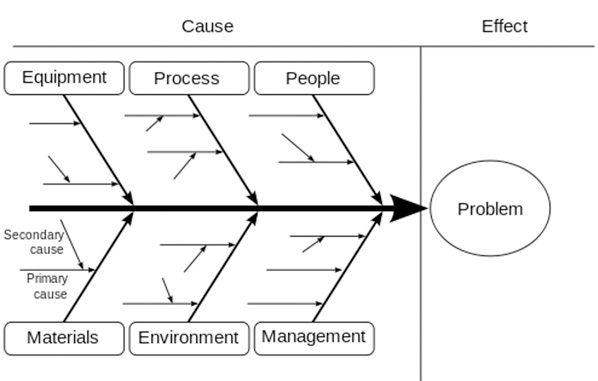
Ishikawa diagram, in fishbone shape, showing factors of Equipment, Process, People,
Materials, Environment and Management, all affecting the overall problem.
Causes
Causes in the diagram are often categorized, such as to the 6 Ms described below. Cause-and-effect diagrams can reveal key relationships among various variables, and the possible causes provide additional insight into process behavior. Causes can be derived from brainstorming sessions. These groups can then be labeled as categories of the fishbone. They will typically be one of the traditional categories mentioned above but may be something unique to the application in a specific case. Causes can be traced back to root causes with the 5 Whys technique. Typical categories are:
The 6 Ms (used in manufacturing industry)
- Machine (technology)
- Method (process)
- Material (Includes Raw Material, Consumables and Information.)
- Man Power (physical work)/Mind Power (brain work): Kaizens, Suggestions
- Measurement (Inspection)
- Milieu/Mother Nature (Environment)
The original 6 Ms used first by the Toyota Production System have been expanded by some to include the following and are referred to as the 8Ms. However, this is not globally recognized. It has been suggested to return to the roots of the tools and to keep the teaching simple while recognizing the original intent. Most programs do not address the 8 Ms.
- Management/Money Power
- Maintenance
The 7 Ps (used in marketing industry)
- Product
- Price
- Place
- Promotion
- People
- Positioning
- Packaging
The 5 Ws (seen in the long term care profession, such as in the CMS Quality Assurance Performance Improvement [QAPI] at a Glance)
- Who
- What
- Where
- When
- Why
The 4 Ps (often used in long term care profession)
- People
- Place
- Policy/Procedure
- Paper (communication)
Regulatory impact to perform RCA
Both the Centers of Medicare & Medicaid Services (CMS) and The Joint Commission (TJC) look to providers and organizations to use and reflect the benefits of RCA. CMS has tools available without fee to help provides reach root causes, noting that QAPI promotes the systematic approach to determine root causes. The TJC framework for RCA and Action Plan provides examples of systematic analysis. This framework includes 24 questions that are intended to provide a template for analyzing an event.
Summary
RCA is an accepted risk management process. It is not a single, sharply-defined methodology. There are many different tools, processes and philosophies for performing RCA, and despite the different approaches there are common principles. An important benefit is that RCA helps the user identify the root cause of fault sequence of a problem, ultimately to resolve the problem. RCA practice after identification is to solve by correcting the cause or events as opposed to simply addressing the symptoms of the problem.